Executive Context
Security, compliance, and revenue functions in most enterprises operate with separate budgets, separate reporting lines, and separate success metrics. The CISO reports incidents prevented and controls implemented. Compliance reports audit findings and regulatory posture. Sales and revenue operations report pipeline velocity and win rates. These three functions rarely share a common data set, and when a cloud or API security gap does surface in a sales cycle, a regulatory filing, or an insurance renewal, it is typically treated as an isolated event handled by whichever function encountered it first, rather than evidence of a shared underlying exposure.
This separation is not a governance failure so much as an organizational default that predates the current evidence base. Security functions were historically built to answer a narrower question, has the organization been compromised, and were staffed, tooled, and measured accordingly. The four revenue pathways this analysis documents did not exist in their current, quantifiable form a decade ago; procurement security review at current scale, SEC-mandated incident disclosure, and evidence-based cyber insurance underwriting are each comparatively recent developments. The organizational structures connecting security to revenue have not yet caught up to the evidence connecting them.
A Composite Illustration
Consider, in composite rather than as a single disclosed case, how these four pathways compound for a mid-market enterprise software vendor with weak cloud and API governance. A prospective enterprise customer's procurement team sends a standard security questionnaire; the vendor's engineering team spends days reconstructing an API inventory that does not exist in current form, extending the security review phase by several weeks, consistent with the delay pattern Vanta's research documents [4]. During that delay, the vendor's cyber insurance renewal arrives, and the underwriter, now conducting technical review rather than accepting self-attestation, prices the policy at a premium reflecting the same documentation gaps procurement just encountered [6]. If an incident occurs before either process resolves, the vendor faces the direct cost categories IBM's research quantifies, and, if publicly traded, a disclosure obligation and associated market reaction on top of them [1][3]. None of these four consequences originates from a separate root cause. They all trace back to the same underlying gap: the organization cannot produce current, credible evidence about its own cloud and API posture on demand.
Current Development or Issue
Three structural shifts, each already established elsewhere in this campaign's research, are converging to make that separation costly. Regulatory disclosure requirements now attach direct, board-visible consequences to cloud and API governance gaps. Cyber insurance underwriting has moved from self-attestation to technical, evidence-based review. And breach cost data increasingly attributes a large share of total financial impact to categories, lost business, customer churn, and detection delay, that sit downstream of the initial technical failure rather than at the moment of compromise itself.
Evidence-Led Analysis: Four Revenue Pathways
Cloud and API governance connects to revenue through four distinct, evidenced pathways, summarized below before each is examined in turn.
|
Pathway |
Mechanism |
Evidence |
|
Direct breach cost |
Detection, notification, response, and lost-business costs following an incident |
IBM: $4.44M global average, 2025 [1] |
|
Market reaction |
Investor and market response to disclosed incidents |
Comparitech-tracked research: ~7.5% average stock decline in 30 days post-disclosure [3] |
|
Deal velocity |
Security and compliance review as a gating step in enterprise procurement |
Vanta: 78% of companies report security reviews caused deal delays [4] |
|
Cost of capital |
Cyber insurance pricing tied to demonstrated control maturity |
S&P Global: premium market growth from $14B (2023) to a projected $23B (2026) [6] |
IBM's Cost of a Data Breach Report 2025 breaks the $4.44 million global average into four expense categories: detection and escalation, notification, post-breach response, and lost business, the last of which captures customer churn, reputational damage, and lost revenue directly [1]. This is the most direct revenue pathway, and it is the one most enterprises already track, even if not always in revenue terms. 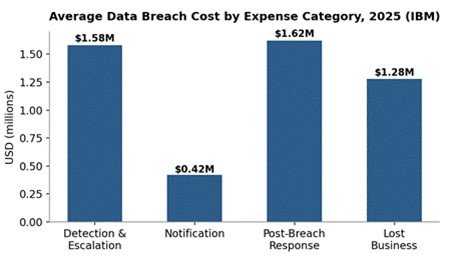
Figure 1. Average data breach cost by expense category, 2025 (IBM).
The second pathway is less commonly tracked inside security or compliance functions: market reaction. Research tracking stock performance following publicly disclosed data breaches has found a consistent pattern of measurable decline, averaging roughly 7.5% relative to broader market indices in the 30 days following disclosure [3]. For publicly traded enterprises, this connects directly to the SEC's cybersecurity disclosure rules this campaign's Whitepaper examined in detail: a material incident does not only trigger a regulatory filing obligation, it triggers a market reaction that the filing itself helps shape.
The third pathway is the least intuitive and, in CyberTech Intelligence's assessment, the most underpriced internally: deal velocity. Vanta's State of Trust Report found that 78% of companies report security reviews caused deal delays in the past year, and Forrester's research on B2B procurement cycles identifies security and vendor risk review as now representing the longest single phase in most enterprise SaaS purchases [4][5]. A cloud and API governance program that can produce current, evidence-backed answers to a procurement security questionnaire measurably shortens this phase; one that cannot, extends it, with direct pipeline and revenue-timing consequences that rarely get attributed back to the governance gap that caused them.
The fourth pathway is cost of capital in its most literal form: insurance pricing. As this campaign's Whitepaper established, cyber insurance underwriting has shifted from self-attested questionnaires to technical, evidence-based review, and S&P Global projects the global premium market will grow from roughly $14 billion in 2023 to $23 billion by 2026 [6]. Organizations that can evidence control maturity are increasingly positioned to capture more favorable terms within that growing market; organizations that cannot are absorbing a larger, less negotiable share of the increase.
Business Implications
The practical implication is that cloud and API governance investment should be evaluated, at least in part, using the same revenue-protection and revenue-enablement logic applied to other enterprise investments, not solely a risk-reduction logic. A governance capability that shortens security review time in procurement is not only reducing risk; it is directly protecting deal velocity and, by extension, revenue recognition timing. A governance capability that produces continuous, current evidence is not only supporting an audit; it is directly supporting more favorable insurance terms.
This reframing has an organizational consequence. If cloud and API governance genuinely connects to deal velocity and cost of capital, then sales, finance, and risk functions have a direct stake in its funding and maturity, not only security and compliance. Few enterprises currently structure governance investment decisions, or governance success metrics, to reflect that shared stake.
Security Implications
None of this changes the underlying technical picture this campaign has documented extensively: Akamai found 87% of organizations experienced an API-related incident in 2025 with attack volume up 113% year-over-year, and Wallarm found 43% of vulnerabilities added to the CISA Known Exploited Vulnerabilities catalog in 2025 were API-related [2][7]. What the revenue framing changes is the argument for addressing it. A security team requesting budget to close an API inventory gap is making a risk-avoidance argument. A security team that can show the same gap is extending procurement cycles by weeks and increasing insurance premiums is making a revenue-protection argument, one that finance and revenue leaders are structurally better positioned to act on quickly.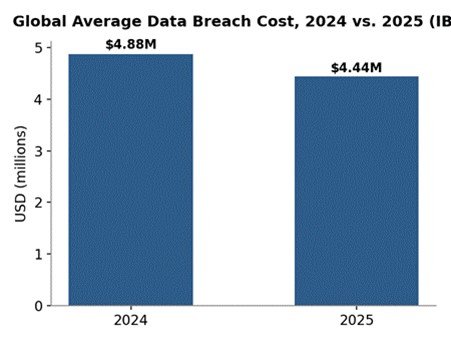
Figure 2. Global average data breach cost, 2024 vs. 2025, the first year-over-year decline in five years (IBM).
Market or Vendor Implications
This dynamic is reshaping vendor and partner selection criteria as much as internal governance. SaasFort's 2026 analysis of enterprise security questionnaires found that NIS2 now adds explicit supply chain security requirements to vendor review processes, including 24-hour incident notification and board-level accountability provisions, while DORA adds ICT third-party risk provisions specific to financial services counterparties [8]. Enterprises selecting cloud and API-dependent vendors are, in effect, importing that vendor's governance maturity into their own revenue-risk profile, which means the four pathways described above apply not only to an enterprise's own posture but to every vendor whose APIs and cloud services sit inside its critical path. A vendor risk program that only asks whether a supplier passed a prior assessment, rather than what its current posture looks like, is applying yesterday's evidence to today's decision.
Ownership Across Functions
|
Function |
Traditional Role |
Revenue-Connected Role |
|
Security / CISO |
Prevent and detect incidents |
Produce evidence that shortens procurement review and supports insurance pricing |
|
Compliance / Legal |
Maintain regulatory posture |
Translate governance evidence into disclosure and vendor-review-ready formats |
|
Sales / RevOps |
Own pipeline velocity |
Flag security-review friction as a tracked deal-stage metric, not an unattributed delay |
|
Finance / Risk |
Manage insurance and capital cost |
Connect governance maturity directly to underwriting negotiations |
CyberTech Intelligence Perspective
CyberTech Intelligence's assessment is that the four pathways described above are not four separate business cases for cloud and API governance; they are four measurements of the same underlying capability, the ability to produce current, credible, evidence-backed answers about cloud and API posture on demand. That capability shortens procurement cycles, supports favorable insurance terms, reduces the severity of market reaction to any disclosed incident, and directly lowers the probability and cost of the incident itself. Enterprises that continue to build the business case for governance investment solely around incident prevention are making a true argument, but a smaller one than the evidence now supports.
Strategic Recommendations
The recommendations below are ordered to reflect dependency: measurement has to exist before ownership can be assigned, and evidence has to be produced before it can be used in either a procurement response or an underwriting conversation.
- Track security-review friction as an explicit, attributed deal-stage metric in revenue operations reporting, not as unexplained pipeline slippage.
- Build governance evidence, API inventory, cloud configuration posture, control testing records, in formats that map directly to standard procurement questionnaires (SIG, CAIQ) and insurer requests, not only internal audit formats.
- Include finance and revenue leadership directly in cloud and API governance investment decisions, given their direct stake in deal velocity and cost of capital outcomes.
- Report governance maturity to the board using both risk-avoidance and revenue-protection framing, reflecting the full evidence base rather than the incident-prevention case alone.
Conclusion
The evidence assembled across this campaign, breach economics, audit readiness requirements, API lifecycle governance, Kubernetes-driven API sprawl, and machine identity exposure, converges on a single reframing: cloud and API governance is not solely a defensive function. It measurably affects deal velocity, cost of capital, market reaction, and direct financial loss, four distinct and evidenced revenue pathways that most enterprises currently manage as unrelated concerns owned by unrelated functions. Unifying that governance, and the case for investing in it, around a shared revenue-connected framework is the strategic opportunity this campaign's research points toward, and it is an opportunity available to any enterprise willing to connect data its security, compliance, and revenue functions already collect separately.
Strengthen Your Unified Governance Business Case with CyberTech Intelligence
CyberTech Intelligence helps security, compliance, and revenue leaders build a shared, evidence-based business case for cloud and API governance investment, connecting risk-avoidance and revenue-protection arguments into a single framework boards and finance leaders can act on.
To build a unified governance business case for your organization, connect with CyberTech Intelligence for a Cloud & API Governance Value Assessment.
References
[1] IBM Security / Ponemon Institute. Cost of a Data Breach Report 2025. IBM, 2025. https://www.ibm.com/reports/data-breach
[2] Akamai. 2026 State of the Internet: Apps, APIs, and DDoS Security Report. Akamai, 2026. https://www.akamai.com/newsroom/press-release/ai-transformation-at-risk-ap-is-emerge-as-the-primary-attack-surface-akamai-research-finds
[3] Comparitech, as cited in Nadernejad Media, Top 10 Data Breach & Reputation Impact Statistics (2026). 2026. https://nadernejadmedia.com/top-10-data-breach-reputation-impact-statistics-2026-what-the-numbers-say-about-trust-revenue-and-recovery/
[4] Vanta. Introducing Vanta Trust Center and the State of Trust Report. Vanta, 2026. https://www.vanta.com/resources/introducing-vanta-trust-center-state-of-trust-report
[5] Forrester, as cited in Arcade, Enterprise Sales Cycle: How to Navigate and Shorten It. 2026. https://www.arcade.software/post/enterprise-sales-cycle
[6] S&P Global Ratings cyber insurance premium projections, as cited in Blumira, Cyber Insurance SIEM Requirements: What Underwriters Expect. 2026. https://www.blumira.com/cyber-insurance-siem
[7] Wallarm. 2026 API ThreatStats Report. Wallarm, 2026. https://www.wallarm.com/reports/2026-wallarm-api-threatstats-report
[8] SaasFort. Security Questionnaire Template 2026: CAIQ, SIG & DDQ. SaasFort, 2026. https://saasfort.com/blog/saas-vendor-security-questionnaire-template-2026


