
Executive Summary
Cloud and API risk has stopped being two separate line items on a security roadmap. Across the most current breach and threat research available, from Verizon's 2026 Data Breach Investigations Report to IBM's 2025 Cost of a Data Breach Report, the two failure modes increasingly show up in the same incidents, feed the same cost drivers, and land on the same board slide. Vulnerability exploitation has overtaken stolen credentials as the leading way attackers gain initial access [2]. APIs now carry the largest share of that exploitation [3][4]. And once an attacker is inside, cloud misconfiguration and third-party exposure decide how far the incident spreads and how long it takes to contain [1][2].
This report synthesizes findings from ten authoritative sources, including IBM, Verizon, Akamai, Wallarm, Google Cloud, and OWASP, to answer a specific executive question: not whether cloud and API risk is increasing, which is no longer in dispute, but what it actually costs, and where that cost originates. The findings point to a single conclusion. Cloud and API failures are converging into one measurable economic category, and organizations that continue to budget, staff, and report on them separately are likely underpricing the risk.
Research Scope and Methodology
This report is a research synthesis produced by the CyberTech Intelligence Research Desk. It is not based on a first-party CyberTech Intelligence survey or proprietary breach dataset. All statistics are drawn directly from named, dated, primary industry sources and are presented with their original attribution, distinguishing external evidence from CyberTech Intelligence's own interpretation throughout.
Where sources report materially different figures for a similar question, such as the share of breaches attributed to cloud misconfiguration, this report presents the range rather than resolving it artificially. Vendor-collected figures, including attack volumes and vulnerability counts, should be read as directional indicators of scale rather than universal constants, since methodology, customer base, and reporting window vary by provider. Where a widely repeated industry estimate could not be traced to a verifiable current primary source, it has been excluded rather than restated as fact.
Key Findings
Four findings anchor this report, each traced to named primary research:
|
Finding |
Source |
Headline Data Point |
|
APIs are now the leading attack surface |
Akamai, Wallarm |
87% of organizations had an API-related incident in 2025; API attacks per organization rose 113% year-over-year [3][4] |
|
Vulnerability exploitation overtook credentials as initial access |
Verizon |
31% of breaches now begin with vulnerability exploitation, versus roughly one-fifth the year before [2] |
|
Cloud misconfiguration remains a disputed but material cost driver |
Verizon, IBM, Google Cloud |
Estimates of misconfiguration's share of initial vectors range roughly 15%–23% depending on methodology [1][2][8] |
|
Detection speed is the largest lever on final breach cost |
IBM |
Breaches found after 200 days cost $5.49M on average versus $3.61M for faster containment [1] |
Market and Threat Overview
The broader threat landscape described in the 2025–2026 research cycle is one of accelerating scale rather than novel attack types. IBM's X-Force Threat Intelligence Index 2026 found that exploitation of public-facing applications rose 44% year-over-year, with vulnerability exploitation becoming the single most common initial access technique across the incidents X-Force investigated, accounting for 40% of cases [9]. Notably, 56% of the vulnerabilities exploited in these incidents did not require authentication to trigger, meaning attackers increasingly do not need stolen credentials at all to gain a foothold [9].
Google Cloud's Cloud Threat Horizons Report H1 2026 adds an identity-centric view specific to cloud environments. Identity compromise underpinned 83% of cloud-related compromises analyzed, threat actors targeted data directly in 73% of incidents, and third-party software-based entry accounted for 44.5% of observed initial access activity, overtaking weak credentials as the leading vector into cloud environments specifically [8]. Read alongside Verizon's broader dataset, a consistent pattern emerges: the perimeter attackers are exploiting is no longer the network edge. It is the combination of exposed applications, APIs, and the identities and third-party connections behind them.
This shift is occurring against a backdrop of rapid API growth. Salt Security's research found that two-thirds of organizations reported API growth exceeding 50% in the past year, and that nearly 90% are already using generative AI in API development, meaning the API estate is expanding faster than most governance processes were built to track [5].
Evidence and Analysis
APIs as the primary attack surface.
Akamai's 2026 State of the Internet security report found that 87% of organizations experienced an API-related security incident in 2025, and that the average number of API attacks per organization per day rose from 121 to 258, a 113% year-over-year increase [3]. Akamai's security leadership has described this shift directly, characterizing APIs as having overtaken web applications and network infrastructure as the primary enterprise attack surface.
Wallarm's 2026 API ThreatStats Report adds a vulnerability-level view to that traffic data. Of 67,058 vulnerabilities published in 2025, 11,053, or 17% of the total, were API-related. Of the 245 vulnerabilities added to the U.S. Cybersecurity and Infrastructure Security Agency's Known Exploited Vulnerabilities catalog during the year, 43% were API-related, making APIs the single most common exploited surface in that dataset [4][10]. Wallarm's analysis of 60 publicly disclosed API breaches found broken authentication responsible for 52% of cases and unsafe consumption of third-party APIs responsible for 27%, categories that map closely to the OWASP API Security Top 10, still the reference taxonomy for API-specific risk as of mid-2026 [4][6].
The AI and API risk surfaces are also converging directly. Of 2,185 AI-related vulnerabilities identified in 2025, 786, or 36%, directly overlapped with API vulnerabilities, meaning more than a third of AI-specific flaws are also API flaws [4]. AI governance conversations that do not account for the underlying API layer are addressing a fraction of the actual exposure.
Vulnerability exploitation overtaking credentials.
For nineteen years, Verizon's Data Breach Investigations Report tracked stolen credentials as the dominant initial access vector. That changed in the 2026 edition. Exploited vulnerabilities are now the most common single initial access vector, accounting for 31% of breaches, up from roughly one-fifth the year before [2]. Credential abuse still appears in 39% of breaches when Verizon traces the full progression of an attack rather than only its starting point, indicating that vulnerabilities increasingly provide the entry point while standing credentials, API keys, OAuth tokens, and cloud service-account permissions determine how far an attacker can move afterward [2].
Verizon also quantified how slowly organizations close this gap in third-party environments specifically. Third-party involvement now appears in 48% of breaches, up from 30% the year prior, and only 23% of third-party organizations fully remediated multi-factor authentication gaps in cloud accounts once notified. Weak passwords and permission misconfigurations in third-party environments took a median of nearly eight months to resolve [2].
Misconfiguration: a persistent but disputed cost driver.
Cloud misconfiguration is one of the few figures in this space where credible sources genuinely disagree on magnitude, and that disagreement should be stated plainly rather than smoothed over. Research linked to Verizon's dataset puts cloud misconfiguration at roughly 15% of initial breach vectors [2]. Other cloud-focused research attributes closer to 23% of cloud security incidents directly to misconfiguration [1]. The pattern is not confined to cloud infrastructure alone: OWASP's Top 10:2025 update, finalized in January 2026, promoted Security Misconfiguration from fifth to second place among the most common application security risks, its largest single-category rise since the list's 2021 edition [7]. What the sources agree on is the underlying mechanism rather than the precise headline figure: publicly accessible storage, overly permissive identity and access management roles, disabled logging, and unencrypted data stores are recurring, well-understood configuration states that continue to appear in investigations years after they were first identified as common risks.
IBM's Cost of a Data Breach Report 2025 provides the clearest cost signal tied to this pattern. Breaches involving data spread across multiple environments, meaning public cloud, private cloud, and on-premises together, cost an average of $5.05 million, compared with $4.01 million for breaches confined to on-premises systems alone [1]. Complexity itself carries a measurable price, independent of any single vulnerability.
Detection speed and final cost.
IBM's 2025 report puts the global average cost of a data breach at $4.44 million, a 9% decline from the prior year's $4.88 million and the first drop in five years [1]. That global figure masks sharp divergence. The United States average reached $10.22 million, the highest figure IBM has recorded for any country, driven by litigation exposure, regulatory penalties, and higher notification costs [1]. Healthcare breaches averaged $7.42 million, the most expensive industry for the fourteenth consecutive year, followed by financial services at roughly $5.56 million [1].
Detection speed remains the single largest lever on these figures. Breaches identified after 200 days cost organizations an average of $5.49 million, compared with $3.61 million for breaches contained faster, a gap of nearly $2 million tied entirely to how quickly an organization notices what has already happened [1]. Organizations with extensive security AI and automation in place reported breach costs roughly $1.9 million lower on average than those without, largely attributable to faster detection and containment rather than prevention alone [1].
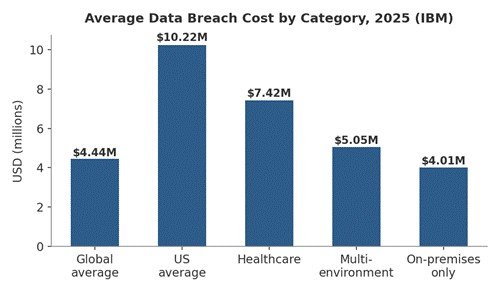
Figure 1. Average data breach cost by category, 2025 (IBM Cost of a Data Breach Report 2025).
Industry Comparison
The averages above obscure meaningful sector differences. Healthcare's position as the most expensive breach category for fourteen consecutive years reflects two compounding factors: the high per-record value of protected health information under regulatory frameworks such as HIPAA, and the operational disruption that follows when patient-facing systems go offline, which IBM links to slower recovery timelines than in most other industries [1]. Financial services, averaging roughly $5.56 million per breach, carries a different cost profile driven more heavily by fraud exposure and customer-notification obligations than by downtime alone [1].
For both sectors, the API and cloud findings above are not abstract. Financial services APIs increasingly carry payment initiation, account aggregation, and open-banking data flows, placing them squarely inside the vulnerability-exploitation trend Verizon describes [2]. Healthcare's expanding use of cloud-hosted clinical systems and third-party diagnostic APIs places it directly inside the multi-environment cost premium IBM identifies [1]. Neither sector can treat cloud or API risk as a generic, industry-agnostic line item; the cost consequences are sector-specific even where the technical causes are shared.
Manufacturing and technology sectors, meanwhile, remain among the most targeted by initial access volume according to IBM X-Force, reflecting the scale of public-facing infrastructure and API integrations these industries expose to support supply chain and partner ecosystems [9].
Enterprise Implications
For CISOs and risk committees, three implications follow directly from this evidence rather than from speculation about future trends.
First, API risk reporting deserves the same board-level visibility that ransomware and phishing already receive. An 87% incident rate combined with a 113% year-over-year increase in attack volume describes a present-tense operating condition, not an early-warning indicator [3].
Second, misconfiguration should be tracked and reported as an ongoing exposure metric rather than a one-time audit finding. The disagreement among researchers about the precise percentage of breaches it causes matters less than the consistent finding that the underlying errors are process failures, addressable through automation and continuous validation rather than one-off remediation projects [1][2].
Third, third-party and multi-environment exposure should be priced explicitly into vendor risk decisions. An eight-month median remediation time for known third-party cloud gaps is not a vendor management footnote; at the scale Verizon describes, it represents a measurable extension of dwell time across nearly half of all breaches [2].
CyberTech Intelligence Research Desk Observation
The CyberTech Intelligence Research Desk views these findings as describing one converging economic pattern rather than four independent problems. External research firms each measure a piece of the picture: Akamai and Wallarm quantify API-specific exposure, Verizon quantifies initial access and third-party dwell time, IBM quantifies final cost, and Google Cloud quantifies identity's role in cloud-specific compromise. None of these sources set out to measure the same thing, yet their findings connect end to end: an API vulnerability or exposed cloud interface creates the entry point; misconfigured identity and access controls determine how far an attacker can move once inside; third-party and multi-environment complexity extends both blast radius and remediation time; and detection speed, not the initial vulnerability alone, ultimately decides the final cost.
This is a CyberTech Intelligence interpretation of the connections between these datasets, not a claim made by any single source cited above. Organizations that continue to fund API security, cloud security posture management, and third-party risk management as separate, uncoordinated budget lines are likely underpricing the aggregate exposure, because each program in isolation only ever reports a fraction of the breach chain that the incident data shows in full.
CyberTech Intelligence Enterprise Cloud & API Security Maturity Framework™ — Breach Data Benchmark
CyberTech Intelligence recommends evaluating the findings in this report against the CyberTech Intelligence Enterprise Cloud & API Security Maturity Framework™, which organizes cloud and API risk into five pillars: Runtime Visibility, API Governance, Machine Identity Security, Telemetry Intelligence, and Continuous Governance. Applying this year's breach data to each pillar produces a directional benchmark that boards and CISOs can use to prioritize investment.
|
Framework Pillar |
Relevant 2025–2026 Finding |
Benchmark Signal |
|
Runtime Visibility |
87% of organizations had an API incident; attack volume up 113% [3] |
High urgency — most organizations lack full visibility into active API traffic |
|
API Governance |
43% of CISA KEV additions were API-related; broken authentication caused 52% of analyzed breaches [4][10] |
High urgency — authentication and inventory gaps remain the top governance failure |
|
Machine Identity Security |
Third-party involvement in 48% of breaches; 23% full MFA remediation rate [2] |
Moderate-to-high urgency — non-human and vendor credentials are under-governed |
|
Telemetry Intelligence |
Multi-environment breaches cost $5.05M vs. $4.01M on-premises [1] |
Moderate urgency — fragmented telemetry across environments raises cost |
|
Continuous Governance |
200+ day detection adds nearly $2M in cost; AI-assisted detection saves ~$1.9M [1] |
High urgency — detection speed is the single largest cost lever available today |
This benchmark is intended as a directional prioritization tool, not a certified maturity score. Organizations should use it to identify which pillar represents their largest current cost exposure based on their own incident history, rather than as a universal ranking.
Strategic Recommendations
Three actions follow directly from this benchmark and require no new technology category to begin.
First, connect API traffic and vulnerability data, cloud configuration posture, third-party risk scores, and detection-time metrics into a single reportable view, rather than maintaining them as separate program dashboards. The incident data shows these signals as one breach chain; internal reporting should reflect that.
Second, prioritize authentication and inventory controls for APIs above broader API governance initiatives, since broken authentication and unsafe third-party API consumption account for the clear majority of analyzed breach causes [4].
Third, treat detection speed as a funded initiative rather than a byproduct of other security investments, given that the gap between fast and slow detection is worth close to $2 million per incident on IBM's data alone [1].
Executive Outlook
The 2025–2026 data does not describe a new category of risk. It describes a familiar set of risks, namely vulnerable applications, misconfigured infrastructure, slow detection, and unmanaged third-party access, converging into a shared cost structure faster than most security programs have reorganized to reflect it. APIs have become the leading edge of that convergence, not because they are inherently less secure than other systems, but because they now carry the largest and fastest-growing share of exploitable exposure. Cloud misconfiguration and third-party access compound whatever an API vulnerability starts, and the final cost of any given incident is decided less by which of these categories caused it than by how quickly it was found.
For enterprise leaders, the economic case for connecting these disciplines is no longer theoretical. It is written into the same reports that already justify security budgets; the change required is reading them as one dataset instead of several.
Enterprise Cloud & API Risk Benchmark Review
Organizations seeking to understand where they sit against the benchmark in this report can request a CyberTech Intelligence Enterprise Cloud & API Risk Benchmark Review, which applies the five-pillar framework above to an organization's own API inventory, cloud configuration posture, and third-party exposure data.
Strengthen Cloud and API Risk Visibility with CyberTech Intelligence
CyberTech Intelligence helps enterprise security and risk leaders quantify cloud and API exposure using current incident, vulnerability, and cost data rather than static checklists. Our research and advisory team supports CISOs and risk committees in connecting API risk, cloud configuration posture, and third-party exposure into a single reportable view, consistent with the benchmark presented in this report.
To assess how these findings apply to your organization, connect with CyberTech Intelligence for an Enterprise Cloud & API Risk Exposure Review.
References
- IBM Security / Ponemon Institute. Cost of a Data Breach Report 2025. IBM, 2025. https://www.ibm.com/reports/data-breach
- Verizon. 2026 Data Breach Investigations Report. Verizon, 2026. https://www.verizon.com/business/resources/reports/dbir/
- Akamai. 2026 State of the Internet: Apps, APIs, and DDoS Security Report. Akamai, 2026. https://www.akamai.com/lp/soti/app-api-ddos-security-report-2026
- Wallarm. 2026 API ThreatStats Report — The New API Risk Multiplier. Wallarm, 2026. https://www.wallarm.com/reports/2026-wallarm-api-threatstats-report
- Salt Security. H1 2026 State of AI and API Security Report. Salt Security, 2026. https://salt.security/api-security-trends
- OWASP. OWASP API Security Top 10. OWASP Foundation, 2023. https://owasp.org/API-Security/
- OWASP. OWASP Top 10:2025. OWASP Foundation, 2026. https://owasp.org/Top10/2025/
- Google Cloud. Cloud Threat Horizons Report H1 2026. Google Cloud, 2026.


